
Recently, market volatility has been attributed to various things. Some commentators have focused on the Trump/Xi battle on tariffs and others have blamed the pain in the UK but my experience tells me this is just noise. These things are just distractions for long-term investors and they will pass.
Just 24 months ago, nobody was predicting the US/China trade war, so you can be pretty certain very few if any will correctly predict the outcome. Of course, professional investors can look very wise discussing the outcomes of present scenarios they completely failed to predict.
I believe the volatility we are witnessing reflects an adjustment to a very new reality – that the distributing of trillions of dollars like confetti, through central bank bond buying since the GFC, is over. The ‘extend and pretend’ theme is dusted. Consequently, the combination of high equity market valuations and the prospect of a slowing economy has struck fear into the hearts of many investors, especially those who paid too much for growth and high beta small caps.
Let’s look at some facts.
Chart 1. Robert Shiller’s Cyclically Adjusted PE
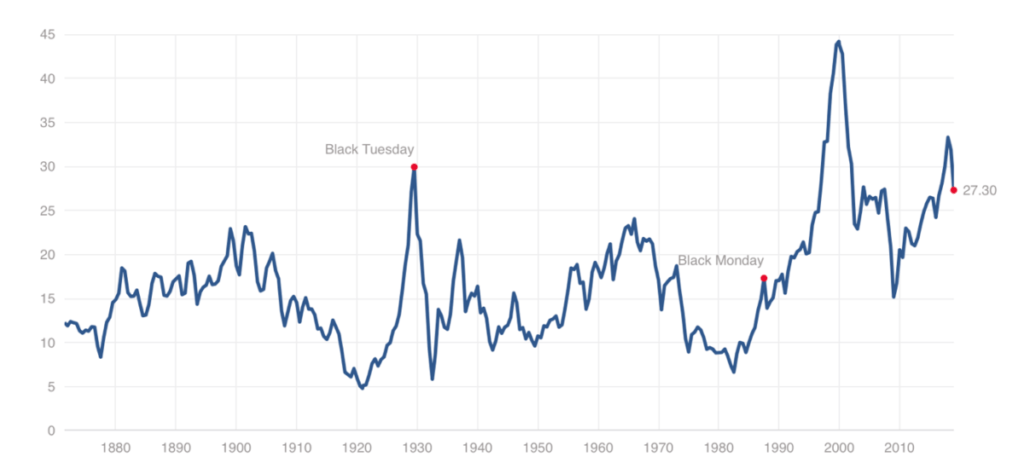
Robert Shiller’s CAPE ratio sits at just under 30 times. Go all the way back to 1870, and you find only two periods where the ratio was higher. Once just prior to the Great Crash of 1929 and the second time during the dotcom boom of 1999.
Meanwhile, Warren Buffett has said it was an absence of value that blocked virtually all deals he examined last year, which explains why Berkshire Hathaway’s cash pile has grown so much.
Chart 2. Berkshire Cash Pile
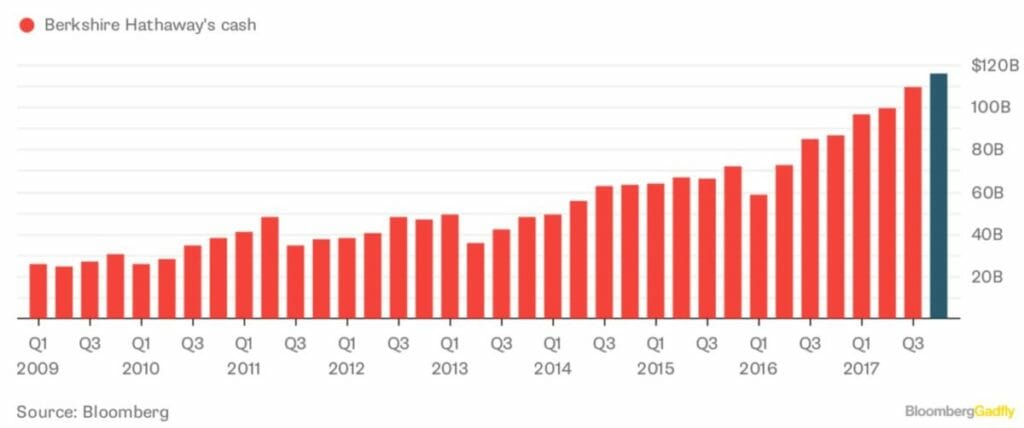
This Bloomberg chart shows cash at Warren Buffett’s Berkshire Hathaway was at a record high in 2018 and must now be approaching US$135 billion ($189 billion). That cash balance represents about 27 per cent of Berkshire’s market capitalisation but because Berkshire trades at a premium to its book value, the cash balance is about 34 per cent of the company’s book value. It is Buffett’s biggest portfolio position.
It’s reasonable to conclude the major market index remains expensive (although for smaller investors than Buffett, there will always be individual companies that represent good value).
The question is what will happen next? If every investment banking analyst and market strategist is distracted by trade wars and Brexit convulsions, what might be the catalyst to provide investors with an opportunity in 2019?
My take is the catalyst might come from the credit markets.
Back in April 2016, in an Interview for Peter Switzer, I warned investors about rising default levels in the US, saying “I’m very concerned that we’re about to see some sort of credit event,” and “Between now and 2020…we’re going to see, in the US alone, something like $947 billion refinanced, and that’s junk bond debt. “In 2020 alone, $400 billion, it is the most ever.”
Then again in October 2017 – more than a year ago – I wrote an article for Professional Planner in which I stated: “The Bank of International Settlements is concerned by the rise of ‘covenant-lite’ junk bonds, which now account for 75 per cent of all leveraged bond issues. Moody’s says covenant quality is at its lowest level since it started measuring this in 2011.”
Value investors like us tend to be early with our warnings and often the party ramps up after we have left, but 2019 and 2020 are now on investors’ doorsteps and Treasury bonds’ rates make them much more attractive than corporate bonds.
The lowest-rated investment-grade bonds – BBB-rated bonds – have grown to 47 per cent of all corporate bonds. This is a record. With the massive increase in the net debt-to-EBITDA ratio – to levels much higher than those seen at the peaks of the previous two cycles – and with half of BBB companies in the US and Europe looking more high yield than high grade, this year could bring a wave of downgrades.
Investors should be concerned that if these downgrades transpire, there will be a wave of selling by managers that can hold only investment-grade bonds.
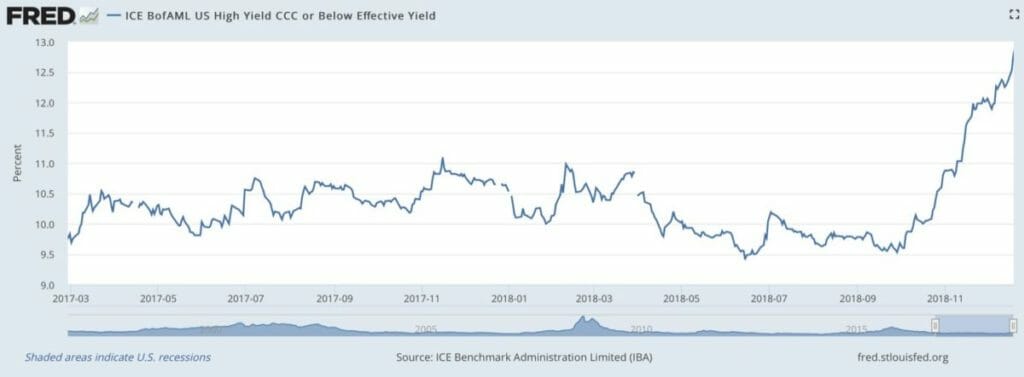
There’s also the record level of CCC-rated bonds due to be refinanced, which we have been alerting investors to since April 2016. From September through December 2018, the BofAML US High Yield CCC or Below Effective Yield has risen from 9.57 per cent to 12.37 per cent, as Chart 3 shows.
Chart 3. BofAML US High Yield CCC or Below Effective Yield
 With Treasury bond rates having risen from 1.36 per cent in mid-2016 to over 3.20 per cent more recently, the appetite for refinancing lower-rated companies has probably diminished and the rates at which they will be refinanced, if they are refinanced, will be higher.
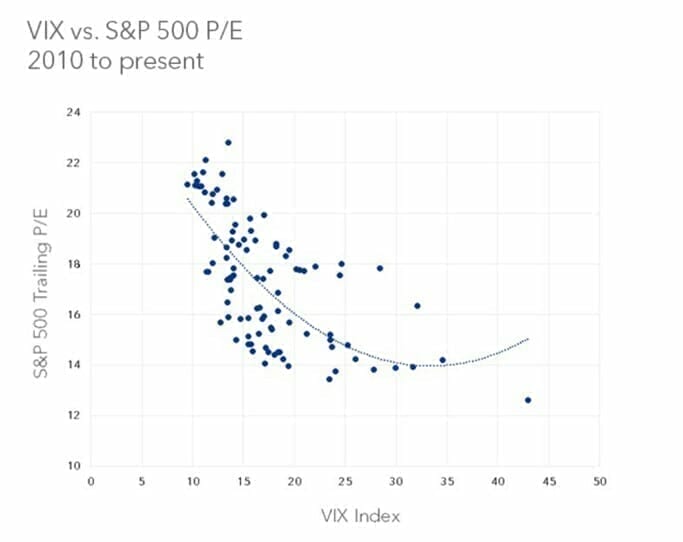
It’s not a stretch to expect more volatility this year. And when perceived risk is higher, investors aren’t willing to pay such high multiples for a dollar of earnings. The final chart reveals an inverse relationship between risk (horizontal axis) and PE ratio (vertical axis). When volatility rises, the multiple investors are willing to pay for a dollar of earnings declines.
Chart 4. Inverse relationship between volatility and PE
So, even though we aren’t calling a crash, per se, my guess is 2019 will bring more volatility, which translates into lower premiums. That means the year ahead should present some terrific opportunities to buy high-quality businesses at cheaper prices. I anticipate contacting investors at some point during the year who will be expecting prices so mouthwatering that more capital may need to be allocated to high-quality equities to be all set for the decade that follows.


Leave a Comment
You must be logged in to post a comment.