
Imagine my feelings when the ASX 200 Index rocketed up in July and my “clever” strategy of buying an ETF on the dips still looked a bit dead in the water.
Like one should, each week I plotted my “buy points” against the ASX 200 and felt good. I plotted one such chart in the July issue of Professional Planner. Just a glance at that chart said to me it was a good plan at that time, but not great. I bought IOZ, my preferred exchange-traded fund (ETF), on the dips defined by me in earlier contributions to this magazine.
But it came time to reconcile my positions at the end of the year and I looked at my trades compared to the price of the ETF. Most of them were slightly underwater. My pricing signals are based on the ASX 200 and not the ETF. I just assumed the ETF hugged the index close enough – as the unhedged S&P 500 did in my June article in this magazine.
I’ve plotted the trades against the ETF itself, rather than the benchmark, in Chart 1.
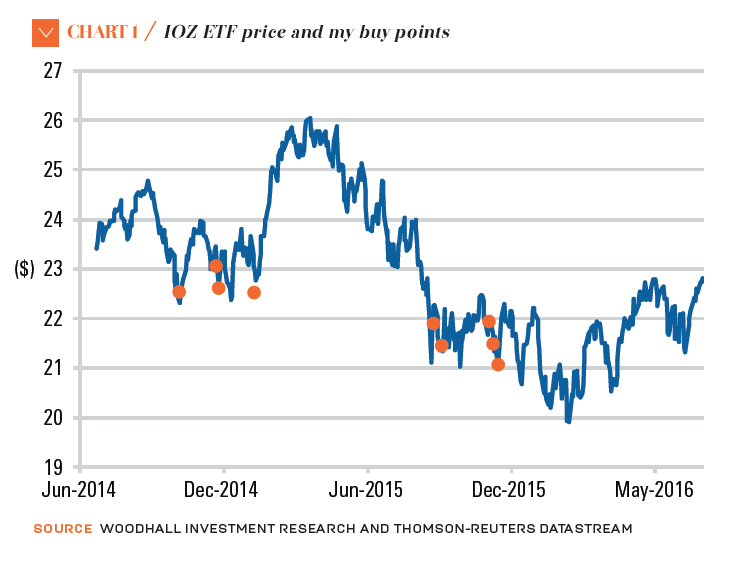
As you can imagine, before the July run-up, most trades were underwater. I know there is a risk that an ETF can wander from its benchmark NAV (net asset value) as, indeed, the ASX website warns us. But by that much? I focused on price rather than total returns as I usually would because I planned to use the yield to pay the interest on this geared portfolio.
In Chart 2, I redo Chart 1 as an accumulation index – the plot I nearly lost!
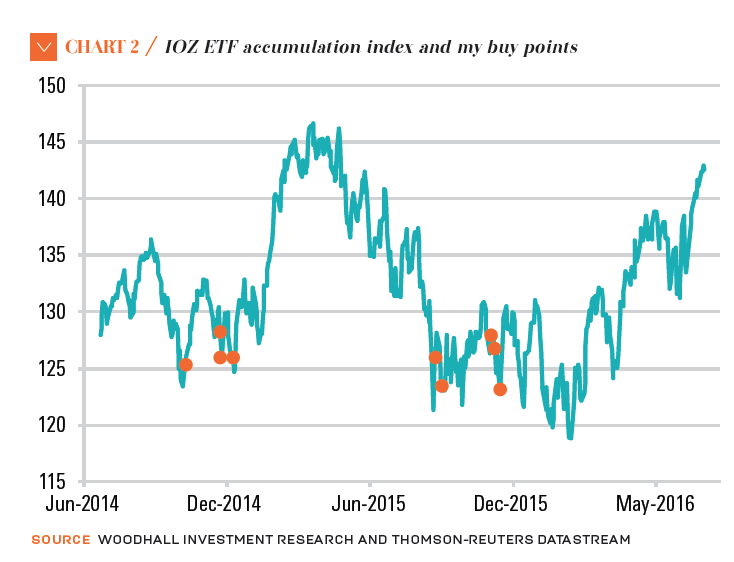
What has happened is that in FY2016 in particular, the ETF underperformed the benchmark in capital gains by a substantial amount, but it outperformed in yield. Naturally I went to other ETF providers on this benchmark and found that, from time to time, their ETFs wander too. It really matters from where returns are measured.
There are publications of NAVs and ex-dividend date actions to contend with. This observation makes me wonder if I can build a pricing signal to tell me which ETF is currently mispriced. I’m not quite there yet but diversification across ETFs is one easy way to go while I think.
So the return on my strategy as an internal rate of return on capital gains alone was plus 2.7 per cent a year since inception to the end of July. But it was a handsome plus 10.0 per cent a year when dividends are included. No negative gearing here!
And, unlike with S&P/ASX accumulation data, I entered the dividends when they reached my account and not when the ETF went ex-dividend.
But what is the appropriate benchmark for my strategy? I was ready to invest on July 1, 2014 but my signals told me to wait. It also kept me out of the market on the big run to 6000 in early 2015. There is no straight answer but, if I invested on July 1, 2014 and held, I would have made plus 6.2 per cent on total returns. That will do me.


Leave a Comment
You must be logged in to post a comment.