

Produced in partnership with Betashares.
The 2026 Budget proposal to replace the 50 per cent capital gains discount with cost-base indexation reintroduces an old structural problem: capital gains and capital losses are calculated on different cost bases. For investors holding a portfolio of direct shares, that asymmetry can result in tax being paid on a real economic gain that simply isn’t there. Pooled investment vehicles, including ETFs, could potentially mitigate the problem.
The Government’s framing is that investors will only be taxed on their real capital gain. In a static, single-asset world, that framing holds. But in the real world, many Australians hold more than one stock or single investment, and the way indexation works in practise has a quieter consequence that the headline numbers don’t capture: gains and losses are no longer measured against the same yardstick.
Under the proposed reversion to pre-1999 indexation, a capital gain is calculated by reference to the indexed cost base. A capital loss is calculated by reference to the original (nominal) cost base. The two never meet in the middle.
Proposed reversion to CGT indexation: the triangle of sadness
Under the pre-1999 CGT indexation regime, the cost base of each asset is uplifted in line with CPI over the holding period. However the calculation of a capital gain or loss is different depending the value of each individual asset at disposal. If an individual asset or share is sold for:
- More than its indexed cost base: a taxable capital gain is recognised, calculated as sale proceeds less the indexed cost base
- Between the original and indexed cost bases: there is no recognised taxable capital gain or loss
- Less than the original cost base: a capital loss is recognised, calculated as sale proceeds less the original cost base. Indexation does not apply to losses.
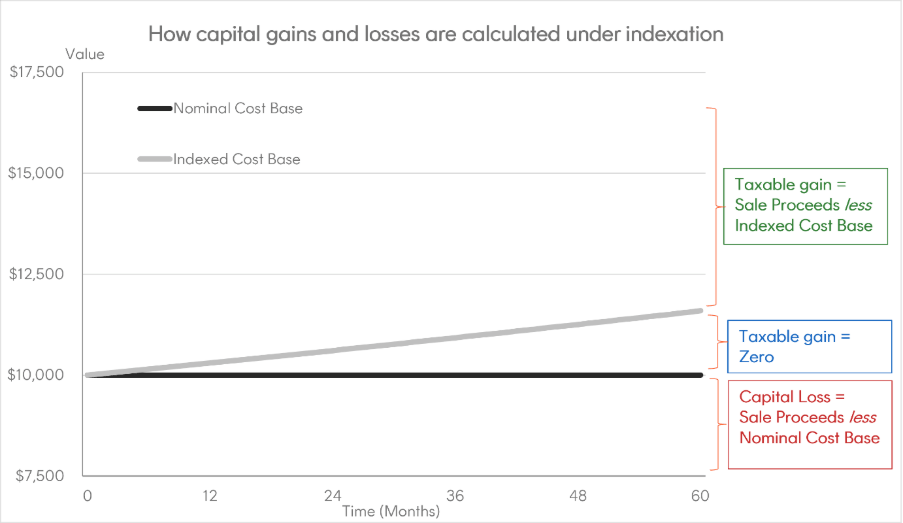
Hypothetical example only, assumes cumulative indexation factor of 1.15 over five years. Indexation shown as a linear increase for simplicity. Actual tax outcomes will vary depending on individual circumstances. Source: Betashares.
The middle zone in the chart above is the problem – the triangle of sadness, if you will. It is the gap between the two cost bases, and it widens every year the asset is held. Real economic losses that fall inside the gap are invisible to the tax system, so they cannot be used to offset real economic gains elsewhere in the portfolio.

Applying the proposed rules to the three-stock portfolio
Below we show the outcomes under CGT indexation for that same three stock portfolio, assuming that the cumulative inflation of 15 per cent. On the surface, the proposed regime produces a lower taxable gain for the stocks A and B that are sold for more than their purchases prices. That is the headline the Government wants you to see. But strip out the 50 per cent discount that the current regime then applies to look at the real return outcomes on a portfolio level, and the comparison changes.
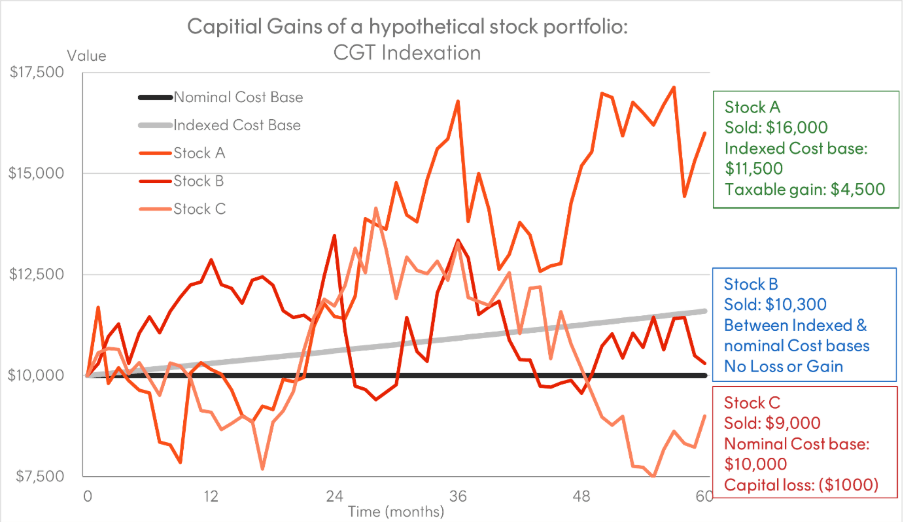
Hypothetical example, assuming a reversion to pre-1999 CGT indexation treatment, purchase price of each stock holding is $10,000 and all are held on capital account for five years with a cumulative indexation factor of 1.15, before being sold for the figures shown. Actual tax outcomes will vary depending on individual circumstances. Source: Betashares.
As result the taxable net capital gain for the portfolio is $3500. Yet the investor’s real gain at a portfolio level is only $800, after accounting for cumulative inflation of 15 per cent over five years on the $30,000 initial investment. Assuming the investor’s marginal tax rate is 47 per cent, they would pay approximately twice as much in tax as the real gain, leaving them significantly behind after inflation.
Why a pooled vehicle can structurally mitigate the problem
Now consider the same three stocks held inside a single pooled investment vehicle, whether a managed fund, an ETF or a listed investment trust. The investor’s cost base is the unit price they paid, not the prices of the underlying stocks. The fund itself is the CGT asset.
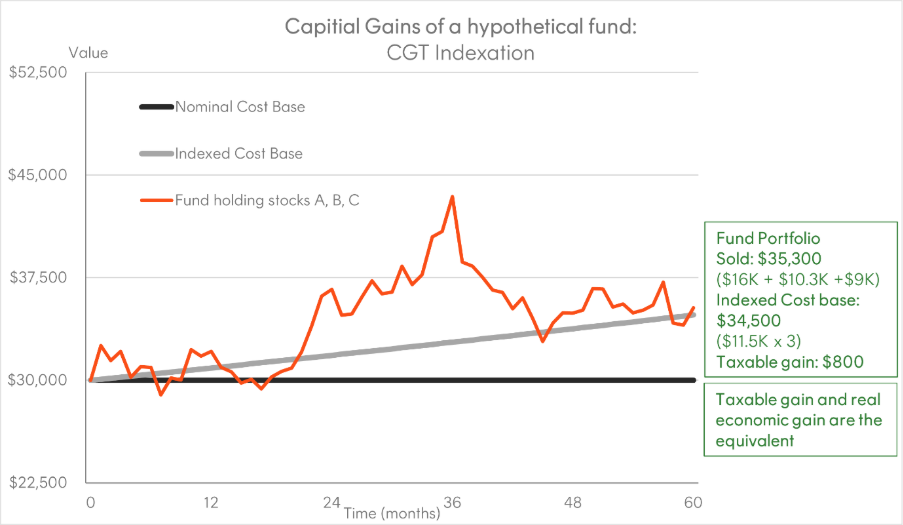
Hypothetical example only, assuming a reversion to pre-1999 CGT indexation treatment, purchase price for the fund is $30,000, which is held on capital account for five years with a cumulative indexation factor of 1.15, before being sold for the figure shown. Actual tax outcomes will vary depending on individual circumstances. Source: Betashares
In our example, the investor buys units at a cost base of $30,000 (the sum of the three $10,000 stock holdings) and redeems at $35,300 (the sum of final portfolio value). The fund’s cost base of $30,000 is indexed up to $34,500. The taxable gain is $800, matching the portfolio-level real economic gain. The investor is not penalised with a higher tax bill as a result of some of the stocks within the portfolio underperforming inflation.
One important caveat is that this example assumes the fund or ETF simply buys and holds those three stocks – there is no turnover within the fund over the five-year period.
Why ETFs may be a better solution in a world of CGT indexation
There was one important caveat within the arguments above for a pooled vehicle, such as an ETF or unlisted managed fund. The comparisons above assume that the ETF or fund had no turnover during the five-year hold period.
Turnover within the portfolio held by a fund leads to capital gains being distributed to the investors in that fund, and at the margin this tax drag detracts from after-tax performance. However index-tracking ETFs are generally more efficient at reducing ongoing CGT than unlisted funds.
As we have said before, the proposed CGT changes are not a reason in themselves to change your asset allocation. But structure matters more than ever. The new rules strengthen the case for holding growth assets in tax-efficient structures. Superannuation, investment bonds, and ETFs held outside super are materially more efficient than alternatives such as direct stock investing or unlisted funds.


Leave a Comment
You must be logged in to post a comment.