
I love it when my hunches are overruled by my hard data analysis! Like most people, I wasn’t thrilled at the May- October 2017 ‘crab movement’ on the ASX 200. In the October 2017 issue of Professional Planner, I bemoaned the frustration at our market moving sideways but I still felt optimistic. In my introspective rumblings, I questioned my personal asset allocation between the ASX 200 and the S&P 500 (both hedged and unhedged) because the balance just seemed wrong.
So I thought it time to update by strategic holdings. (I’m too old and obese to jump around in a tactical manner!) In the December 2012 issue of this magazine, I argued strongly that it is reasonable to be overweight Aussie equities. In fact, the header was “When it comes to Aussie equities, it’s OK to be overweight – or even obese”. My recommendation then was about 50/50 for a low-volatility allocation.
When I updated my views in the May 2016 issue, I used my full blown risk-return trade-off optimisation to get 59 per cent Australia/41 per cent overseas.
After another 18 months, on October 1 of this year, I did my analysis again, and the results amazed me. My 12-month-ahead capital gains forecasts were 6.7 per cent for Australia and 11.5 per cent for the S&P 500 (on October 1, 2017). Despite this, when dividends, franking credits and volatility forecasts are taken into account, the optimal allocation using my metrics has moved only to 60 per cent Australia/40 per cent overseas – so how does this add up?
Naturally, I plotted the accumulation indices for the two markets over these 18 months, which does not allow for Australian franking credits. I show this data for my investments in Chart 1. IOZ is the iShares exchange-traded fund for the ASX 200, IVV is the iShares ETF for the S&P 500, and IHVV is the currency-hedged version. To my surprise, over this particular 18-month period, it didn’t matter one jot if you were IOZ or IVV or both! And it would have helped only a fraction to have held a position in IHVV – the hedged index.
Chart 1: ASX 200 and S&P 500 accumulation indices to September 30
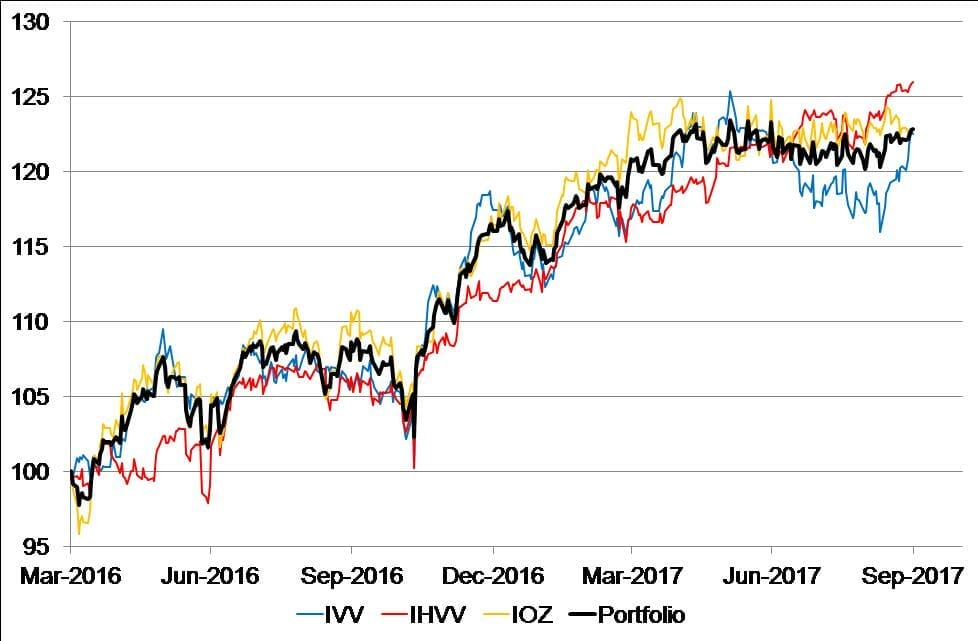
The start and end points for such comparisons are critical, of course. In this case, the start point happened to have been a low for the ASX 200. But this is why I don’t try to game the allocation over shorter periods; it is so easy to get it wrong.
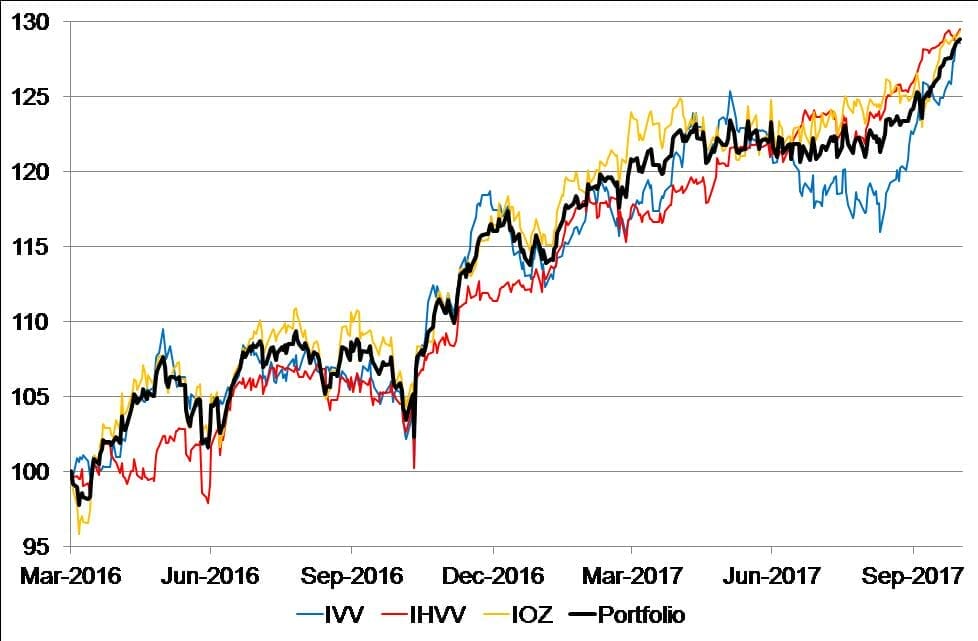
The astute reader might well wonder what has happened since October 1. As I thought – or at least hoped – the ASX 200 was ready for a run. And we got one. There is data to the end of October in Chart 2.
And again, it doesn’t matter! But it would have at certain points along the way. IVV dropped near the end of the period because of currency changes. But now all the options happen to be back together again.
So, why bother? Because life is not always like this. Asset allocation is as much about risk as it is return. But what about currency hedging?
Unlike many analysts, I think the Australian economy is in trouble. Rates are still more likely to go down rather than up in the foreseeable future. The rest of the world is on the up. I am about 50 per cent hedged because I don’t want to pay the price for gambling on the currency (it’s too hard). I think our dollar is on the way down, which is why I reversed some hedging when the Aussie hit 80 US cents.
If I were fully hedged, I would just about get the full S&P 500 returns. Why do I want more for gambling on the currency? Because I can get it! But only 50 per cent of my international exposure is at risk. If the dollar gets below 70 cents, I might start increasing my hedge ratio.
Chart 2: ASX 200 and S&P 500 accumulation indices to October 31
Source: Thomson Reuters Datastream & Woodhall Investment Research


Leave a Comment
You must be logged in to post a comment.