

With super fund limits set to come in, and lifespans lengthening, I am considering taking on more risk in my SMSF to pay for a hopefully long and happy tax-free retirement.
In the August issue of this magazine, I showed some performance statistics for three di erent portfolio constructions of mine. One of these, the high octane, has done well but with more risk. Is it too much risk for my SMSF?
Each month since February 2014 I have produced a new portfolio that is designed to be held for six to 12 months before being rolled into a new octane portfolio. For reasons of space, I am only going to consider the three February portfolios for 2014-2016 joined together. I think this experiment gives a reasonable view of what my other portfolio combinations did.
After choosing sector weights and numbers of stocks based on my risk-return forecasts, I populate the sectors with stocks having the best broker recommendation scores from the top 200. Often, but certainly not always, these selections come from the small caps end of the ASX 200.
The three portfolios had 21, 17 and 22 stocks, respectively. The number of stocks depends upon my predicted sharp ratio for each sector. Again, for brevity, I have only shown the five worst and five best performing stocks from each portfolio in Table 1.
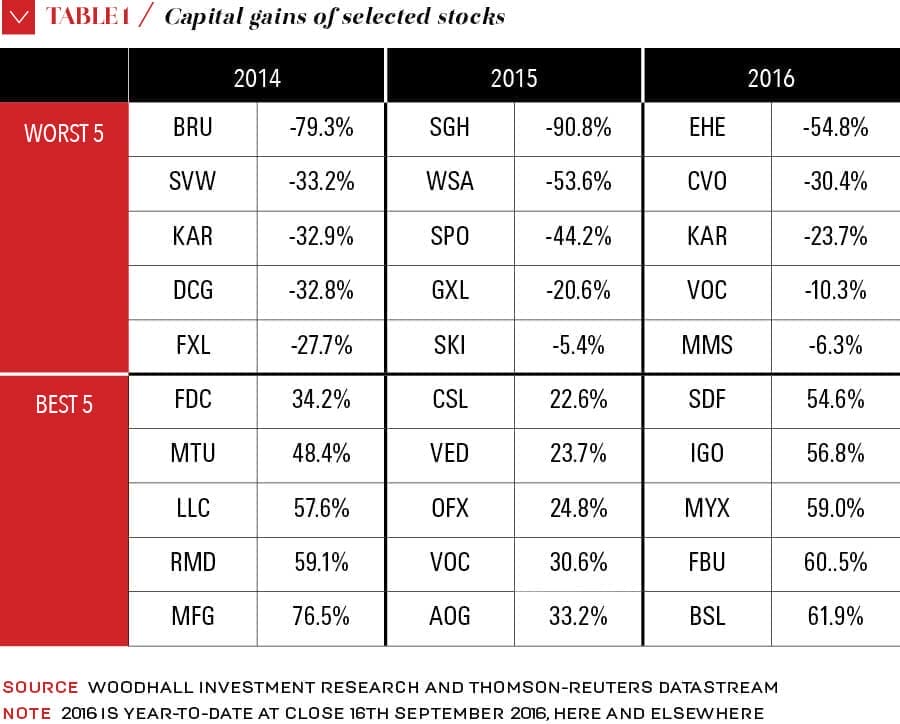
There are some pretty ugly returns in Table 1. That is what I mean by high risk. But there are also some pretty good ones. So what about on balance? In Table 2, I show the capital gains for the three octane portfolios under “normal” against those for the ASX 200.
As it turned out, each of these portfolios did very well in spite of the big losses shown in Table 1. Some of the bene ts come from diversi cation over reasonable numbers of stocks. But the relative ability of brokers to pick winners has to have played a big part.
The question I posed to myself was whether I would have the nerve to hold the losing stocks until the scheduled rebalance. I made an arbitrary decision to sell to cash any stock (in a hypothetical sense) that had fallen 20 per cent more than the ASX 200 on the following day. When I did that, I got the numbers under the stop-loss column of Table 2.
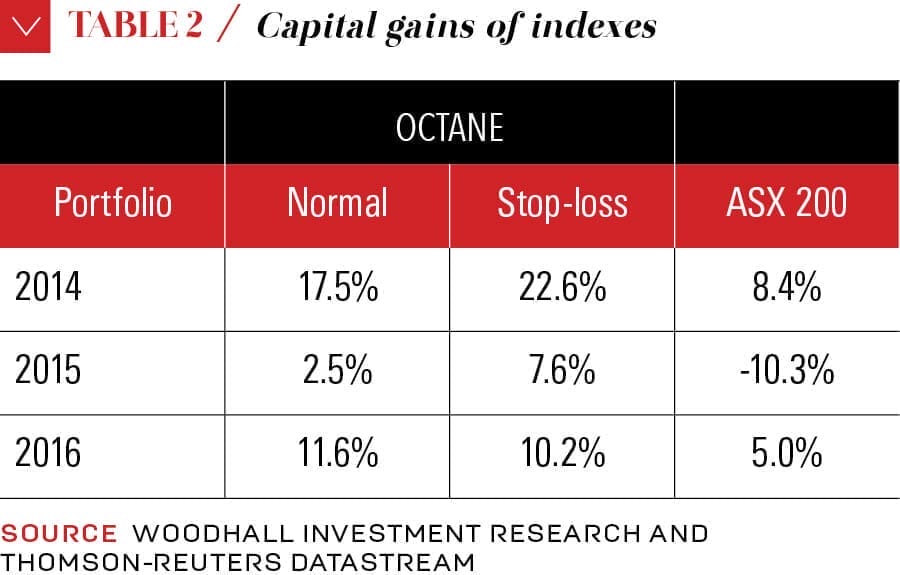
In 2014 and 2015, this stop-loss strategy would have added another 5 per cent or so. But in the shorter 2016, the stop-loss strategy underperformed the buy-and-hold strategy. The reason for that is that one of the stocks in 2016 triggered the stop-loss and then rallied to make a gain by the end of the period.
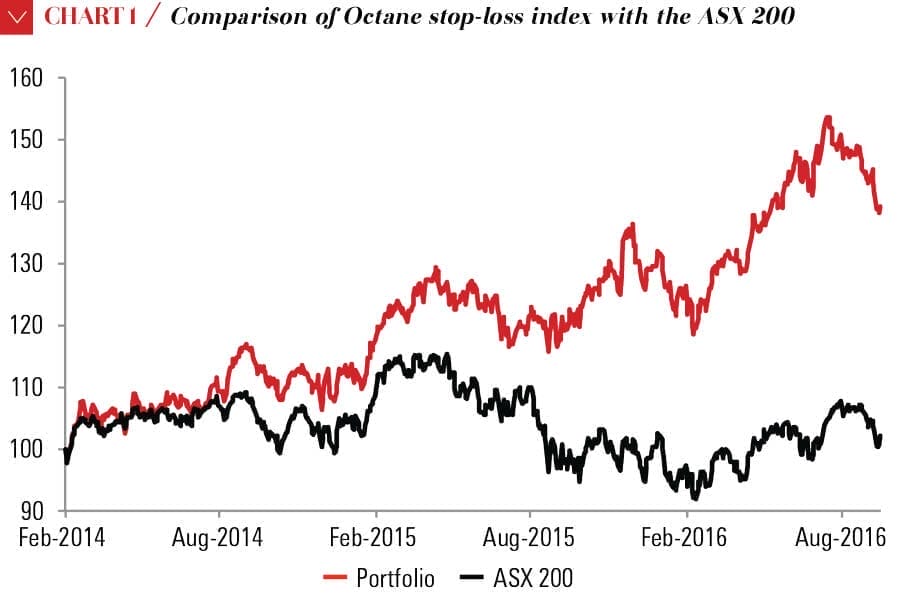
When I joined the three portfolios together, for the stop-loss strategy, I got the price indexes shown in Chart 1. In a relatively at market, this modi ed octane portfolio did really well without too many sharp falls along the way.
There are many other considerations to analyse – such as six-month rebalancing, other stop-loss rules (such as measuring falls from recent peaks), and start points. So far I have found enough support to decide to put part of my SMSF into such a portfolio starting this year. I don’t feel the need to push the risk envelope to the limit – just far enough to add to my conviction returns, now that the yield play has been buried.
For those without access to my sector weights and stock numbers, back-testing something closer to market cap weights might prove fruitful.


Leave a Comment
You must be logged in to post a comment.