
We’re all familiar with the graphs and tables which show the growth in value of a $10,000 investment in a particular stock or asset class over the past five, 10 or 20 years.
They’re usually extremely compelling and designed to make investors feel excited about the benefit and possibilities of long-term investing.
But they’re completely focused on returns.
Returns are definitely important, especially for retirees, but investors can’t think about returns in isolation. They must be considered in the context of their capacity and tolerance for risk.
Risk and return are inextricably linked and in order for an adviser to build a robust portfolio to meet a client’s specific needs and objectives, they first need to understand their tolerance for risk.
When it comes to investing, there are good risks and bad risks. There are risks that people should take and will be rewarded for, and there are those that can derail them from achieving their long-term objectives. If investors get spooked during a temporary bad investment period and sell out, then it doesn’t matter how strong the performance of the asset was over time. The client sold out at the wrong time and their bank balance will reflect that.
Amount of risk a client can stomach
Basically, there are two sides to returns.
Let’s call them financial and behavourial.
The first component is relatively easy to understand. In short, investors aim to get the maximum return on offer.
The second part relates to the risk they’re willing and able to take. The problem is the amount of risk a person can stomach is highly subjective and depends on factors like their personality, age, personal situation and financial position. People commonly don’t understand the different risks they face or the level of risk they can and should take.
A professional adviser’s role is to determine the risk a client can tolerate; the risk they should (and may need to) take to achieve their goals, and then guide them through any periods of discomfort.
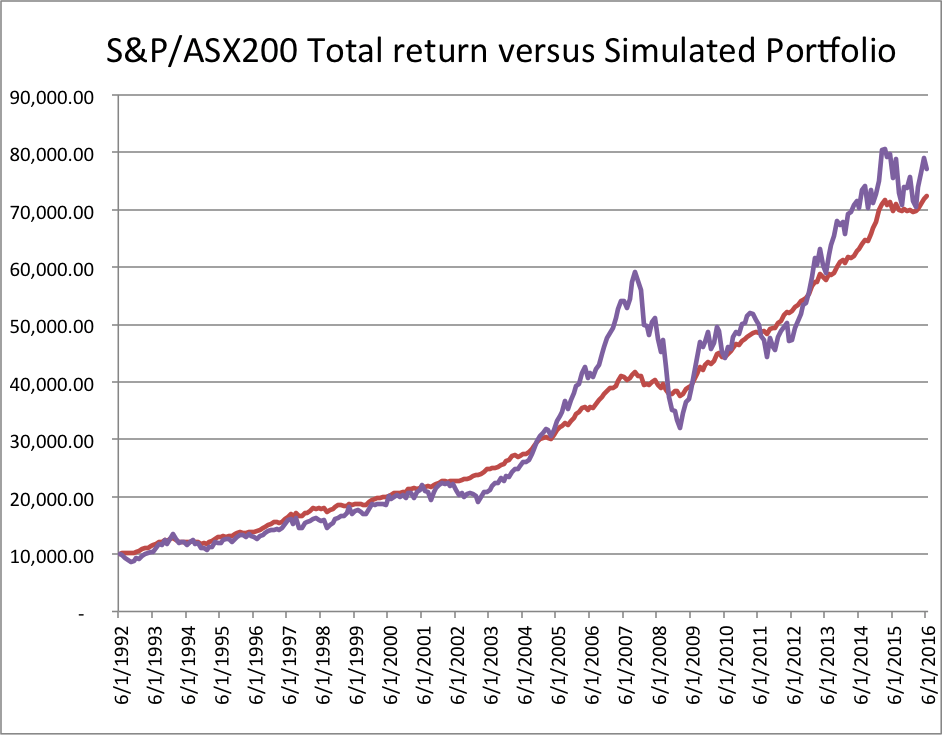
Let’s take a look at a typical growth of $10,000 chart of the ASX200 from 1992-2016 (Purple line) and overlay a hypothetical portfolio on top (Red line). Point-to-point the ASX200 is the better performing asset.
CHART 1
Click to enlarge
Source: Bloomberg and
Innova Asset Management
Given it’s a well-known fact that retail investors commonly buy high and sell low, advisers need to have a clear understanding upfront of their clients’ risk profile.
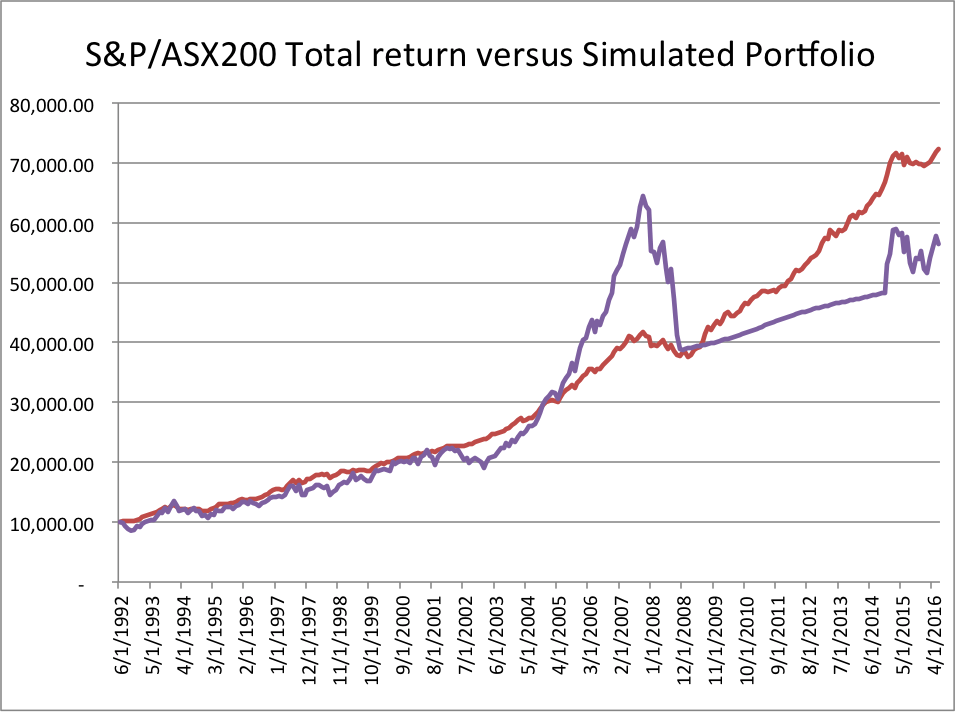
If we overlay this behaviour on the above chart, the results are quite striking. Let’s assume two scenarios. In the first, the client invests $10,000 in the simulated portfolio and never has to touch it because they are happy with their results (red line).
In the second situation (purple line) they initially invest $10,000 in the ASX200 and reinvest all dividends but by the end of 2005 returns have been so good, they “find” another $1000 to invest – and do so every six months until December 2007 (leading to a total investment of $15,000 – or 50 per cent more than the other scenario).
However, in December 2008 they panic and put everything in cash because they can’t handle the volatility and leave the money in cash until 2014 when they invest again (because returns are once again good) – a pretty common occurrence.
CHART 2
Click to enlarge
Source: Bloomberg and
Innova Asset Management
So even though the ASX was the better performing asset, and in the ASX portfolio the client contributed $15,000 instead of $10,000, the simulated portfolio of the $10,000 investment led to more money in the client’s bank account because the risk was managed appropriately and the client’s behaviours were therefore managed as well.
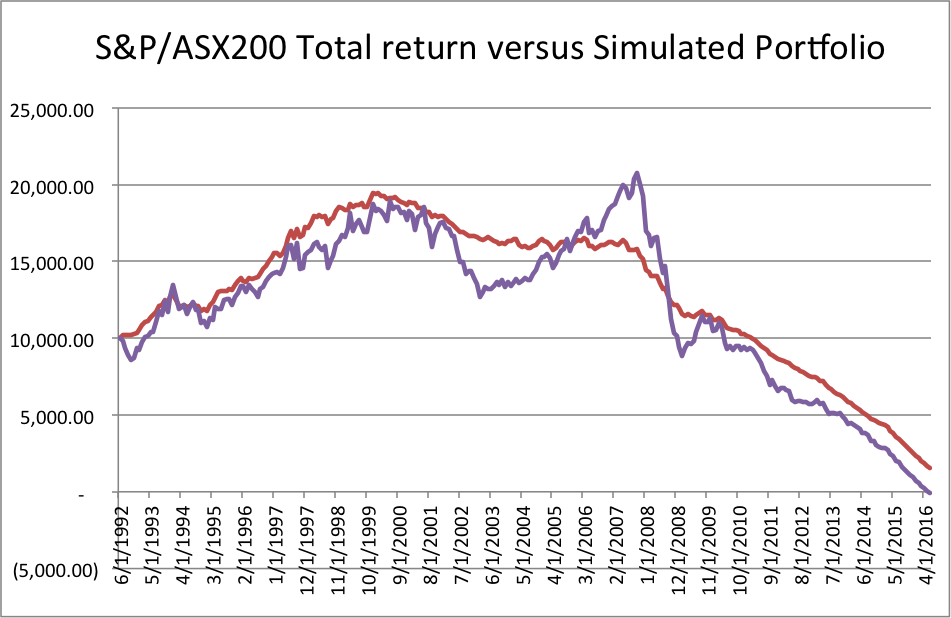
Too stylised an example? Here’s a simpler one. Imagine instead that from January 2000 the client started a “pension” of $175 a month but between June 2002 and June 2003 returns on the ASX were poor, so they increased their drawdown to $200.
They did this again between June 2007 and June 2009 because again, they were scared about market returns being poor and wanted to sell out. In the simulated portfolio they maintained the consistent $175 monthly draw down. What would that mean?
CHART 3
Click to enlarge
Source: Bloomberg and
Innova Asset Management
Yes, the client drew down an extra $900 but their portfolio was more than $1400 worse off. So, once again, the risk managed portfolio, while it had poorer performance, returned more money to the clients’ bank account because the risk was managed more appropriately.
Through advisers determining a client’s tolerance, capacity and need to take on risk, the client’s position and strategy will be clear to them and their adviser even at times when their peers are seemingly making huge gains on risky investments.
What fund managers should do is build solutions that suit a client’s profile.
But that’s a lot easier said than done.
Predisposition to ‘flee from pain’
The funds management industry is led and constrained by historical performance and generally-accepted “rules of thumb”.
Investment professionals and academics examine a hundred years’ of data, extrapolate trends and makes assumptions like “equities will outperform bonds over the long term therefore equities are a better long-term investment”, but that conclusion doesn’t recognise that many individuals can’t stomach the volatility attached to equity markets and human beings have an inbuilt predisposition to flee from pain and adverse situations.
Risk management isn’t only about examining risk factors and diversifying by risk factor. It’s also about educating and coaching investors to make smart investment decisions and stopping them from making poor decisions, like pouring into the market at the top and pulling out at the bottom. At the end of the day, if investors are able to make solid incremental gains and avoid losses, they’ll have more money in their bank account than if they chase the latest investment trends.


Leave a Comment
You must be logged in to post a comment.