

Note: If you haven’t read Part 1, you can do so here
Since the early 1980s long bond rates have been falling. This of course has coincided with the emergence of the Baby Boomers entering the earning and accumulation phases of their lives, ensuring asset prices rose substantially.
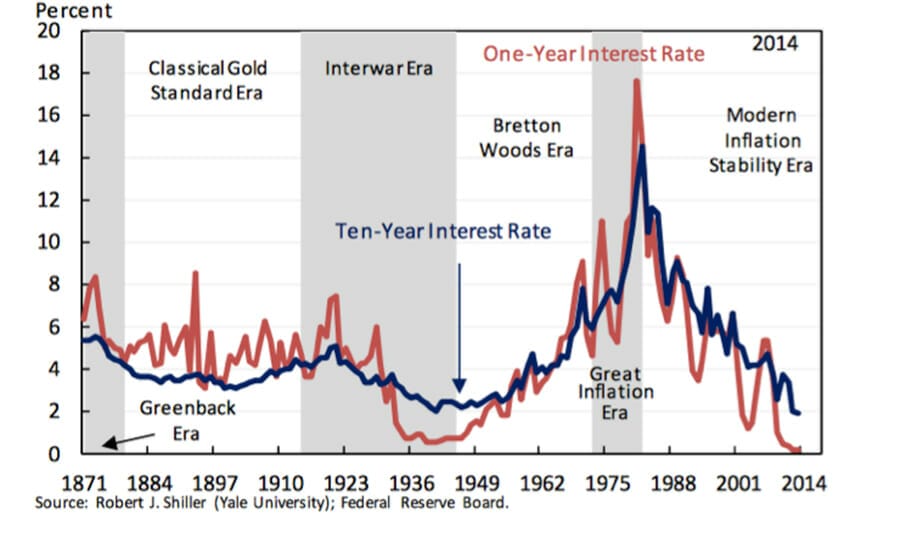
Figure 1: Long and short term rates
Click to enlarge
As Figure 1 reveals, the decline in both long and short term rates has been substantial. Remembering the inverse relationship between interest rates and asset values that I described last month it should be no surprise that asset values – from manufacturing businesses to property, to art and collectible number plates – have risen substantially over the same period.
In a July 2015 paper entitled, Long Term Interest Rates: A Survey, the Council of Economic Advisers to the Executive Office of The President of The United States, revealed they were somewhat perplexed by the long run decline in rates. In their conclusion the opening paragraph states:
“Many factors play roles in the determination of long-term interest rates, including the rate of productivity growth, beliefs about future risks, consumer preferences, demographic shifts, and the stances of monetary and fiscal policy.
As markets have become globally integrated, conditions in foreign markets are increasingly important for US long-term interest rates.
Over the past two decades, long-term interest rates have been falling worldwide. An explanation for why they are so low—and whether those low levels will persist—is one of the most difficult questions facing macroeconomists today.”
One shouldn’t really care what macro economists actually think because their track record is quite poor. Even the consensus view as expressed by the futures yield curve reveals market participants, in aggregate are about 100 per cent wrong when predicting where future interest rates will be.
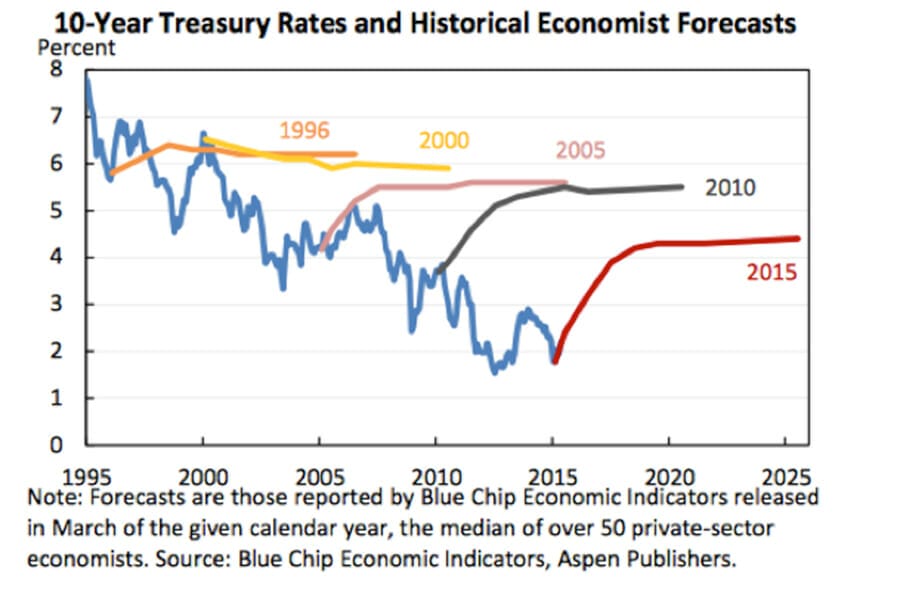
Figure 2 reveals interest rate predictions at various points in time against what interest rates actually did, as represented by the continuous line.
Figure 2. Market predictions and economists are about 100 per cent wrong
 Click to enlarge
As rates fell, economists and the markets predicted they would rise and flatten out. Comparing the end point of each coloured line (interest rate prediction) to the solid line (actual interest rate) at the time shows that the experts don’t offer any insights into where long term rates might go.
Both the Long Term Interest Rates: A Survey report and Figure 2 reveal that not only are experts poor at predicting long-term rates, they cannot reach a consensus explanation as to why rates have fallen as dramatically as they have.
We therefore should conclude that the value of their insights, as to what might happen next, are questionable. The three-decade decline in long-bond interest rates was real, and most worryingly, unexpected.
Consensus, as reflect by financial market prices, and professional forecasters consistently focused on short term cyclical factors and failed to predict the longer-run structural trend.
And that point is very important to remember as the consensus view today is that we have entered a “new normal” – a new era of persistently low interest rates.
Hearing experts talk of a “new normal” one cannot help but conclude such expressions are merely another version of ‘this time is different” – arguably the most dangerous four words in investing.
What do we know?
What we know is that low interest rates have caused investors to chase higher yields and migrate from saving deposits to higher risks assets such as shares, hybrid securities and property.
The yield migration has pushed the prices for generally-accepted “stable” income streams to record highs. On an enterprise-value-to-EBITDA (EV/EBITDA) basis, for example, the infrastructure and utilities sector is more expensive than it has ever been. And within that cohort, Sydney Airport and Auckland International Airport are the two most expensive listed airports in the world. This so-called “new normal” is anything but normal.
Understanding why these stocks are so expensive is helpful in understanding the risks investors are adopting.
When interest rates are low, the discount rates used to present-value the future cash flows are also low. One tool used to calculate a discount rate – in an apparently consistent and repeatable way – is the Weighted Average Cost of Capital (WACC). The cost of capital is the sum of both the cost of debt and the cost of equity, in proportion to their amounts on the balance sheet. But because utility and infrastructure companies are almost fully funded by debt, the discount rate calculated and adopted is just the interest rate on the debt.
As a result, investors are rewarding companies with the most debt the highest valuations.
Not ‘if’ long bond rates will rise, but ‘when’
As I have mentioned already this new normal is anything but normal.
If interest rates on long-term bonds begin to rise, the investors that will be hurt the most could be those who thought their retirement savings were safely tucked away in “stable” income-producing companies.
And the question to ask is not “if” long bond rates will rise again, but “when” will they rise?
Inflationary expectations have some influence over long-term bond rates and less conventional measures of inflation are already rising.
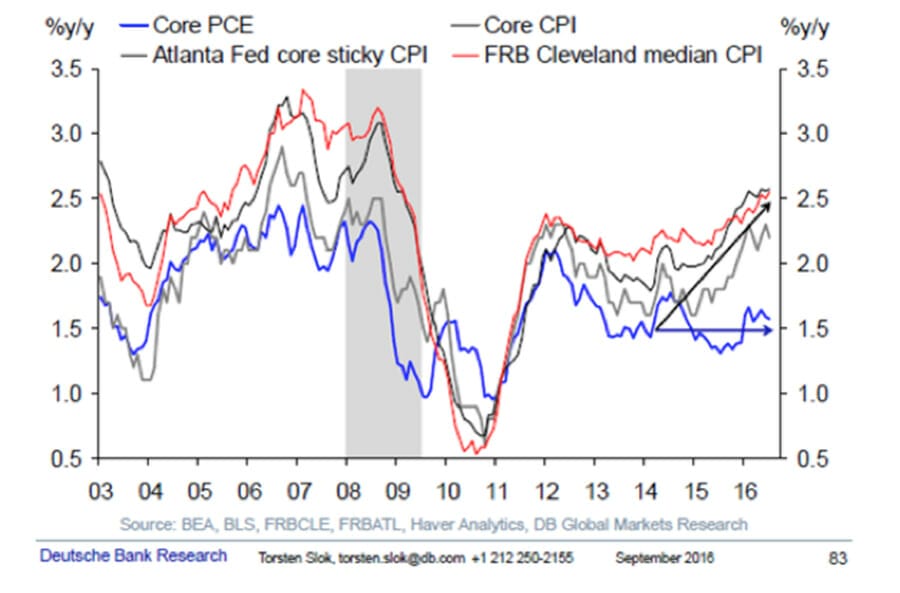
Figure 3 is a chart produced by Deutsche Bank’s Dr Torsten Sløk and it reveals that most measures of US core inflation are already above the US Federal Reserve’s two per cent target “and trending higher”.
Figure 3. Alternative measures of inflation
Click to enlarge
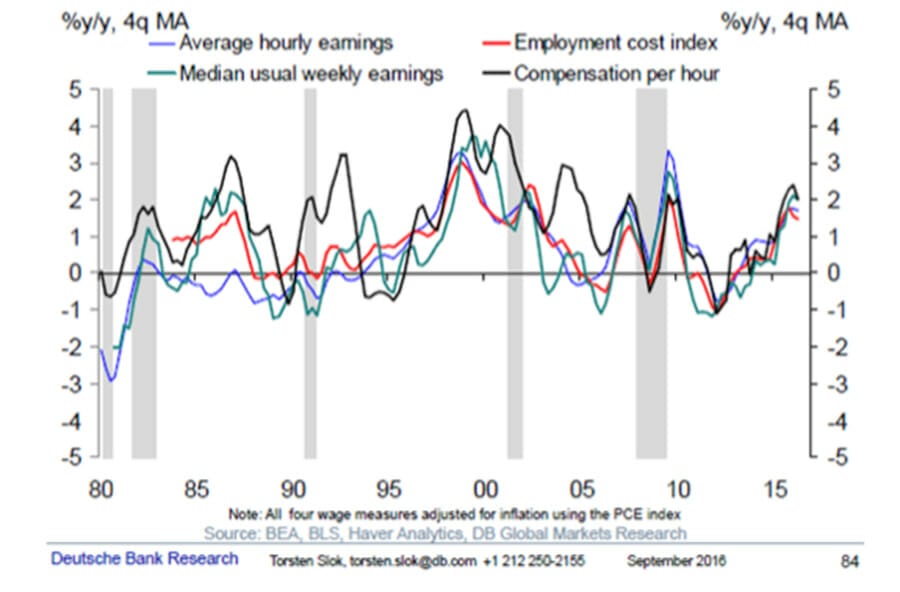
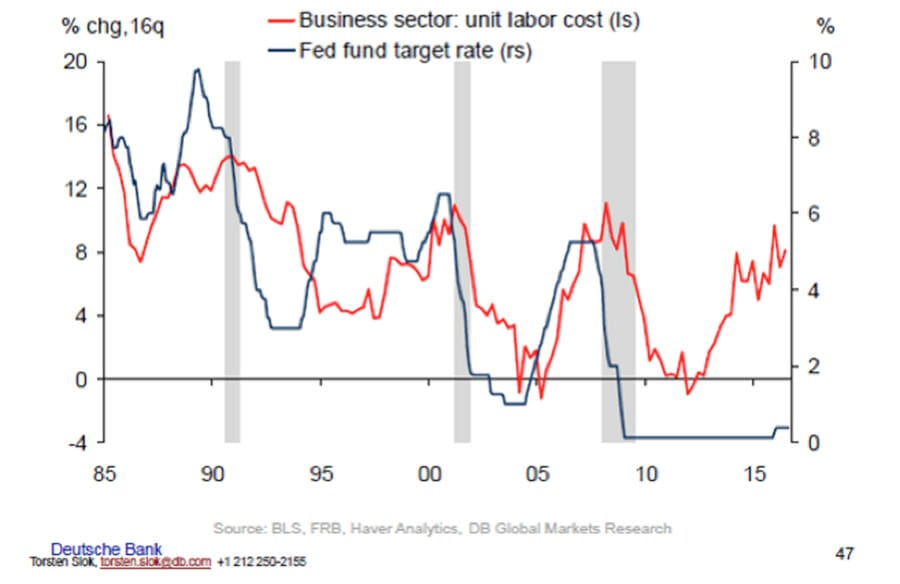
At Montgomery we have previously noted US presidential candidate Hillary Clinton’s desire to raise the minimum wage in the US by close to 70 per cent to over US$12.00. But even in the absence of this increase, Figure 4 reveals labour unit costs are now approaching pre-GFC levels thanks to a tight labour market which can be seen in Figure 5.
Figure 4. Real Wages at 2006 levels and trending higher
Click to enlarge
The tightening labour market is seen in the fall in the US jobless rate from 10 per cent to 4.9 per cent. More importantly, according to Sløk, the “number of people available per job opening is below 2007 levels”. As Figure 5 reveals the Fed appears to have embarked on an experiment to hold rates lower than is justified by the cost of labour.
Figure 5. Rising labour costs. Tightening job market puts pressure on wages
Click to enlarge
It is currently our view that long bond rates are at the end of a 30-year decline, coinciding with the end of an even longer-term expansionary credit cycle. As a result, prices for assets are at extreme highs just as earnings are under pressure to grow without the benefit of credit.
Ten-year bond yields appear to already be slowly marching higher. And the risk of acceleration is underappreciated by investors who may need reminding that the US 10-year bond rate rose by more than 200 basis points in just a few weeks in 1994. And if inflation does indeed emerge as an influence for bond investors, the possibility of traders beginning a fight against the US Fed increases.
The implications for investors in what have been adopted as “safe” stocks is serious, underappreciated and permanent.


Leave a Comment
You must be logged in to post a comment.