
Bonds have played a key defensive role in portfolios since the advent of modern portfolio theory more than six decades ago.
But a deeper assessment of long-term stock-bond correlations and current market conditions suggests this approach is fundamentally flawed.
The October bond market sell-off serves as a timely reminder: global bonds posted their worst monthly performance in six years, losing 3 per cent, while at the same time, many developed equity markets also sank deep into the red.
The assumed diversification benefits of holding stocks and bonds proved sorely lacking.
Some investors will ignore this as short-term market volatility but a review of the long-term relationship between stocks and bonds suggests more complex forces at work.
One goes down, the other goes…
A standard portfolio split 60:40 between growth (typically stocks) and defensive assets (typically bonds) remains a benchmark example of modern portfolio theory.
These two asset classes were chosen because of their negative correlation – when one goes down, the other goes up – creating a superior risk-return outcome for investors.
However, this assumption rests heavily on several factors, including the time period chosen, the quality of the data and statistical analysis, and assumptions that returns and correlations remain stable through changing market conditions and economic cycles.
A look at longer-term data quickly reveals the significant shortcomings of these assumptions.
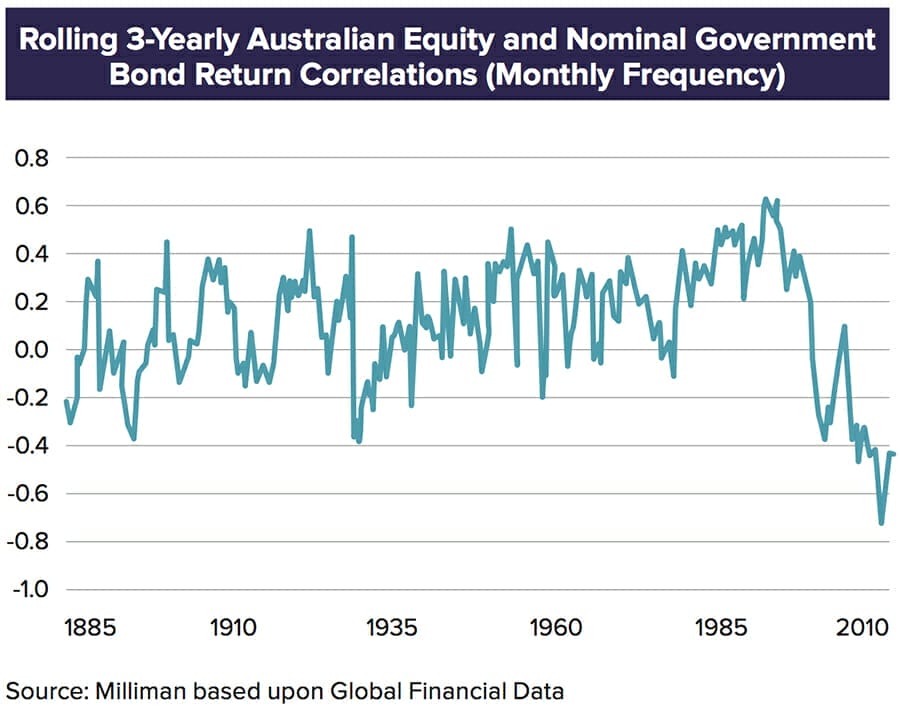
The correlation between the S&P 500 and long-term US Treasuries swung from a low of -93 per cent (bond and stock returns moved in opposite directions) to 86 per cent (bond and stock returns moved in tandem) from 1927 to 2012, according to a study by bond manager PIMCO.
An analysis of three-year Australian equity and nominal government bond returns over a 110-year period shows similarly wild swings between positive and negative correlations, as shown in the diagram below.
Traditional portfolio construction: a perfect storm
The implications for ‘balanced’ portfolios that resemble traditional 60:40 growth-defensive portfolios can be dire.
The following diagram shows that equity markets still drive the underlying risk of a simple, diversified Australian 60:40 equity and government bond portfolio. When the share market nosedived (the 1929 crash, the mid-1970s crash, the 1987 crash, the 90s recession, the 2000 tech-wreck, and the 2008 global financial crisis), so too did this “balanced” portfolio.
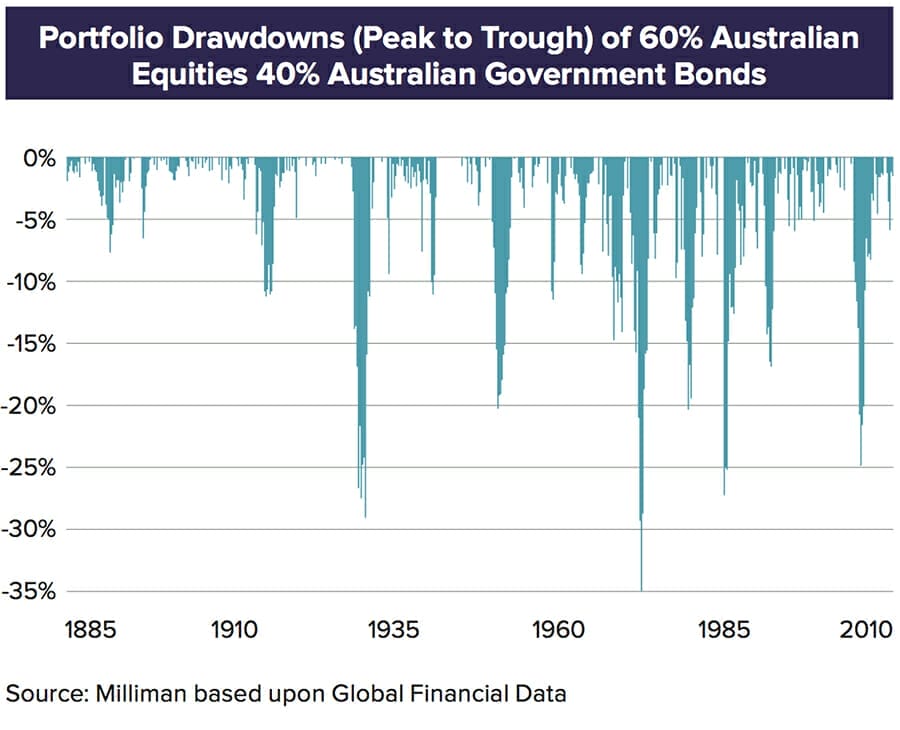
The 60:40 portfolio actually performed worst during the 1970s bear market despite the fact that equity markets performed better during this period than during other market crashes, including the global financial crisis.
The diversification provided by bonds is not only inconsistent, but of little benefit if it disappears when you need it most – as we can see with the 1970s bear market when bonds fell at the same time as equities.
Diversification: look at risk factors, not asset classes
There are a number of underlying risk factors that can potentially make the performance of bonds and stocks more or less correlated. These factors are inter-related and can be challenging to identify but tend to reflect fundamental things such as expectations for (and uncertainty about) growth and inflation, but most importantly – price.
However, these factors have also been twisted in new ways by central banks’ unprecedented quantitative easing policies in the wake of the GFC. These massive asset-buying programs have directly boosted bond returns (and lowered yields) for several years.
The October bond sell-off was partially driven by a change in market sentiment: that QE policies won’t last forever and Europe and Japan may, in fact, shortly begin tapering their programs. Meanwhile, the US economy continues to recover and interest rates are expected to continue rising, albeit slower than initially expected.
US Treasuries were sold off further after Donald Trump’s shock election victory amid expectations that his policies will drive further inflation.
While this has driven yields higher, they still remain historically low (and in some countries in negative territory – in other words, their price is still extraordinarily high). This further weakens the equity-bond diversification argument because bonds are less appealing as a ‘safe haven’ during times of stress (rising demand for bonds would depress yields further). If the starting point is a high price, the likelihood that you’ll get a good return outcome is lowered. If both stock and bond prices are high (because they’ve gone up too far, too fast at the same time), then, unfortunately, they’re more likely to go down together as well.
These complex and shifting dynamics reaffirms our view that the underlying risk factors of each asset class transcends labels such as ‘growth’ and ‘defensive’.
Relying on bonds, equities, and a range of other assets for portfolio diversification is a strategy fraught with danger given they share many of the same underlying risk factors. These factors include economic growth, valuation, inflation, liquidity, credit, political risk, etc.
Identifying these risk factors, and creating portfolios which truly manage them, is a more difficult path to travel but one that will be far more rewarding for investors over the long term.


