
Remember just a few months ago when one big broking house was calling oil prices to fall to $20 while, at the same time, another was forecasting $200? There is nothing new in attention-seeking forecasts – it’s a bit like a girl wearing “killer” heels or a young man driving “that” sports car!
Those of us who invest for a living (rather than just talk about it) need some basis in fact. And fact is thin on the ground in commodity price forecasting. Until the start of the 2014-15 financial year (FY15), all we seemed to have to be really worried about was the slide in iron ore prices.
A deliberate over-supply by the three big guys was to blame – or so we thought/think. Oil prices came on the radar in July 2014, but the OPEC decision not to take action to halt the slide in September 2014 sent shivers down our collective spine.
Whether we look at the US-relevant price (WTI, or West Texas Intermediate) in Chart 1 (click to enlarge) or the “world price” in Brent, oil prices all but halved in the second half of calendar 2014. No one should need charts to know what that did to the ASX 200 – and the energy stocks, in particular.
Closeness of correspondence
What is interesting to me in Chart 1 is the closeness of the correspondence between oil prices (Brent, in particular) and our Aussie dollar (note my manipulation of the vertical scales) until the end of January 2015.
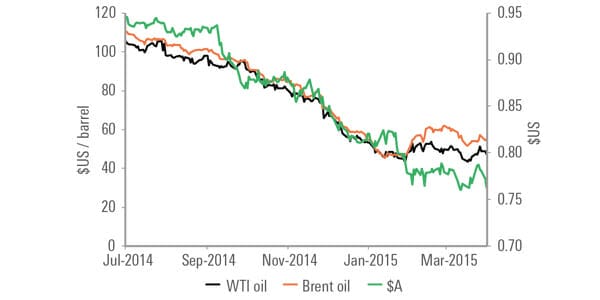 Since the beginning of February 2015, the close relationship between oil prices and the Aussie has broken down. But, hang on, the RBA made its first rate cut on the first Tuesday of February, after 17 months with rates on hold! Perhaps the gap between Brent and the Aussie at the end of Chart 1 is a measure of the impact of that rate cut. So what about the next (and the next) rate cut?
Readers might recall that I derive my market and sector forecasts from broker forecasts of dividends and earnings, as collected by Thomson Reuters. From Chart 2 (click to enlarge) it can be seen that my 12-month-ahead capital gains forecasts for the energy sector took a beating – but with a lag after oil prices started their sharp decline.
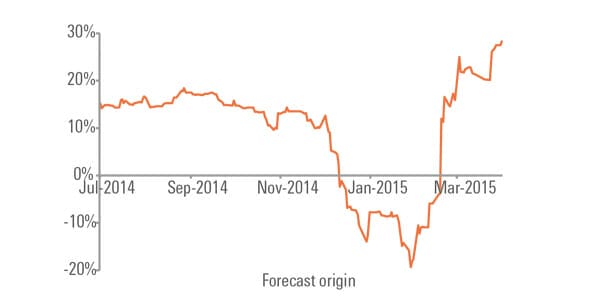 Note that each point on the horizontal axis denotes a new forecast origin for a new, overlapping 12-month forecast horizon.
On the left is a forecast of around 15 per cent for July 1, 2014 to June 30, 2015. On the right is a forecast of around 30 per cent for the 12 months from April 1, 2015 to March 31, 2016 – which in part is accounted for by the overshoot in late 2014. We expect this 30 per cent forecast to start to fall as the data settle down over coming months.
Since I have my own methods for converting broker forecasts of dividends and earnings (as discussed in a report available from my website) it is not easy to say how much of my expected future capital is due to the changes in broker forecasts and how much is due to my methods.
Stable period
But what we can say is that, after a stable period of projected gains that started well before July 2014, the forecasts fell from more than 15 per cent to nearly 20 per cent in a few months, only to bounce back to nearly 30 per cent. Perhaps an over-reaction in late 2014 as the bears came out of hibernation and then headed back into their caves for the northern winter?
The fall in the energy sector forecasts was the main contributor to the decline in my ASX 200 forecasts. Now that energy forecasts are “back in the high life”, my end-of-year forecast of 5900 for calendar 2015 is starting to look far too conservative – but we currently have fair value at 5750 (as at April 1, 2015).
Markets fluctuate.
So while 6000 is on the cards for a number of short periods in the near future – or perhaps even before you receive this issue, owing to production lead times – it now looks like 6000 will well and truly “stick” before the end of calendar 2015.
And then the November 1, 2007, all-time peak of 6829 will then be just a hop, skip and a jump away.
Our current forecast for the high during the rest of calendar 2015 is 6500, but to finish the year at around 6150!