The year ahead is shaping up as a period of transition for the Australian sharemarket, with stronger returns expected in 2015, says Ron Bewley.
As markets recover from the October US debt ceiling/shutdown deliberations, there seem to be few major headwinds left – except, of course, another US political fiasco in January/February 2014 when next the ceiling needs to be lifted. It seems likely the Republicans will have learned their lesson from the October brinkmanship.
On the positive side, tapering seems likely to be put off until well into 2014; Europe is in a reasonable state of management; China has already come back from its controlled slowdown; Japan is sprinting out of the blocks; and business confidence is already coming back at home. So shall we put the good champagne on ice for New Year’s Eve?
To put things into perspective, I have collected some of our 12-month-ahead capital gains forecasts from the start of 2012 (see chart). Our forecasts are derived solely from formula-based manipulation of Thomson-Reuters consensus forecasts of dividends and earnings. If we choose to express our own view, we do it in tandem with our base-line forecasts.
We predicted a calendar 2012 target of about 4900 (green dot); but the possible exit of Greece from the euro, and a statement in May from China that they would not repeat their 2008 stimulus, brought our index tumbling right down. But our 2013 financial-year forecast (yellow dot) was undeterred with a 5000-plus target. These forecasts are based on earnings and dividend forecasts.
ASX 200 and Woodhall’s forecasts
Source: Thomson Reuters Datastream and Woodhall Investment Research
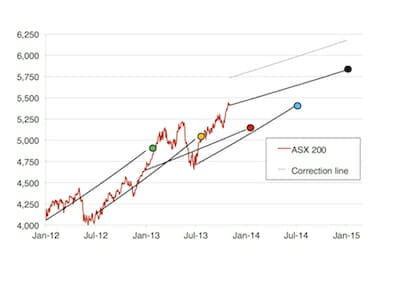
While the green dot forecast was clearly wrong on the day by about 200 points, it did send the right message, as the index surpassed that forecast during the following month in 2013. Our calendar 2013 forecast was for 5150, but we noted in the February issue of this magazine that there was upside from an alternative long-run pricing model that could take us to 5400. Importantly, the Australian Financial Review published a consensus view they collected at the beginning of 2013 – the end-of-year target was 4678, and that target was only upgraded a smidge to 4706 in mid-March. In other words, these forecasts were for a flat 2013.
After we called a possible correction of 6 per cent to 10 per cent on February 22, 2013, the China bears reappeared to take the heat out of the market, arguably basing their view on a misguided interpretation of China’s Purchasing Managers Index (PMI) data. Again, the yellow dot was out by about 200 points – such is the nature of market volatility – but, again within a month, the index climbed above our forecast. In due course we shall find out the fate of the red and blue dots.
Despite our apparent past optimism, our forecasts are starting to pull back a fraction as we go forward – partly due to the dividend constraint on the high-yield sectors and lower (but still strong) earnings forecasts for the materials sector. The last forecast in the chart – ending with the black dot – is based at November 1, 2013 and is projected for an extra two months, to get an idea of what our calendar 2014 target might be when we make that forecast on January 1, 2014.
Combination of forecasts
Our method of estimating mispricing or exuberance is based on a fairly complicated combination of forecasts, such as those in the chart, but updated every month. But to give an idea of what might constrain the market during 2014, the so-called “correction” grey dot-dot-dash line in the chart is placed at 6 per cent above the forecast line. We argue that a correction – or at least a prolonged sideways movement in the market – is likely when the overpricing signal exceeds 6 per cent. That puts 6000 as being unlikely until September 2014 – and any 6000-plus in the first half of 2014 could well be swiftly followed by a correction. Our base-line, sustainable forecast for that heady level is mid-2015.
But with the worst of the GFC-related issues squarely behind us, all of that cash on the sidelines is going to be looking for a new home. Not much can go into high-yield stocks, as that would depress yields too much – unless some funds currently migrate from high-yield to growth stocks. At least one exuberance bubble does seem to be on the cards for 2014. I will be watching my daily updates of the chart – and related proprietary statistics – with great interest. In particular, I will be looking for improved earnings guidance (and with that, the bubbly) as the February reporting season approaches. A big improvement in earnings would bring that 6000 target forward. In short, we see a really good 2015, with 2014 being a more moderate year of transition.
Anyone who is interested can read our weekly updates (usually posted on Saturday mornings) at www.woodhall.com.au. We also have a detailed paper on that site about how we calculate our forecasts and an archive of all of our previous reports.